
Learning is fun and learning about a webpage you like on the internet should add more fun. Did you ever stunned with an element on a webpage and interested in finding out how it was created? You don’t need to look for your HTML or CSS books for that!!! Modern browsers like Chrome offers very easy and potential tools to analyze a web page. This is a practical skill much needed for analyzing the anatomy of a webpage.
Though the primary objective of these tools are to troubleshoot your own, design it can also be used to understand how experts are designing their content so that you can learn the concepts. In this article let us discuss step by step illustration of viewing the source code HTML of a webpage using Google Chrome web browser. If you are using other browsers, learn more on how to view source code in Mac Safari and Mozilla Firefox.
View Webpage Source Code in Google Chrome
Before exploring the source code, it is important to understand the components of a webpage. This will help to read the source code and you can easily find the item you look for in the code. In addition to viewing the source code of a webpage, you can also edit the content live in Chrome for testing purposes. Let us discuss all these topics in details in the following sections.
1. Components of a Webpage
A webpage consists of the following parts in general:
- Page content – Text, images, videos, etc. marked up with HTML.
- Alignment and visual look – Generally controlled with CSS.
- Scripts – triggers action either at client or server side.

The CSS can be used in three different ways on a webpage:
- Inline styles – affecting the visual look of an individual element.
- Internal styles – affecting all elements on a page.
- External stylesheets – affecting all elements on a website.
You can learn how order of CSS styles will affect the look of a webpage. Scripts can also be used in different ways similar to CSS. The webpage source code contains all these components and you can view them in different ways.
2. Viewing Source HTML, CSS Styles and JS
In order to view the HTML content, inline and internal styles of a webpage, open the webpage in Chrome browser. Right-click any place on the page and select “View Page Source” option as shown in the picture below:

Note: If you right-click inside an iframe, browsers will show “View Frame Source” option instead of “View Page Source“.
This will open a new window which will show the marked up HTML content and styles of each elements used on that webpage. Some sites will show you pretty clear source view but most of the modern sites will show the source code without line breaks and spaces. This is a minified and compressed version of the source code, nowadays almost all websites use this format to reduce the size and improve the page loading speed.

3. Viewing External Stylesheets and JS Files
The most popular and recommended way of using CSS is to link external stylesheets to the HTML content. In order to find out the external stylesheets used on a webpage, look for the “link” tags on the source code. Click on the links ending with “.css” to see all the style elements defined in the stylesheet.

A website can use an external stylesheets in different format. Most of the times the CSS files will end with version number or additional text like “.css?Ver1.3”. Sometimes the minified version of the CSS file ending like “.min.css” may also be used for fast page loading. Though the links are showing as relative on the source code, clicking on it will open up the source stylesheet with absolute URL (complete URL with domain name).
Similarly, you can find the JavaScrip files with .js or .min.js extension. Unlike CSS files linked in header section, JS files are linked the footer section of a webpage. This is to avoid scripts blocking the loading of plain text content and improve the page loading speed.
4. Chrome Shortcut to View Page Source Code
You can view any page’s source code directly from the Chrome browser’s address bar by adding the prefix “view-source:” to any page URL. This way you can even view the source code of right-click protected pages also.
view-source:webpage URL
The entered URL will be automatically redirected to fetch the content, if the page has proper 301 redirect. For example, entering “view-source:yoursite.com”, can be automatically redirected to “view-source:https://www.yoursite.com”.
5. Viewing Source Code with Developer Tools
The above explained method will provide the source HTML / CSS code without referring to an individual element present on the webpage. It is a difficult task to find out the styles used for any particular element with the source code view.
Similar to other browsers, Google Chrome offers developer tools in order to access the source code linked to any particular element on a webpage. Right-click on any element on a webpage and choose “Inspect” option to open the developer console. You can also open developer console from the menu path “Three dots vertical icon > More Tools > Developer Tools“. By default, browser console will open at the bottom of a webpage which you can change to side or in new window as per your preference.

The console is divided into two parts with various tabs available under each section. The left side portion displays the HTML content of a page under “Elements” tab and the right side portion shows the CSS under “Styles” tab. Clicking on any CSS links will open the style sheet in left portion under “Sources” tab.
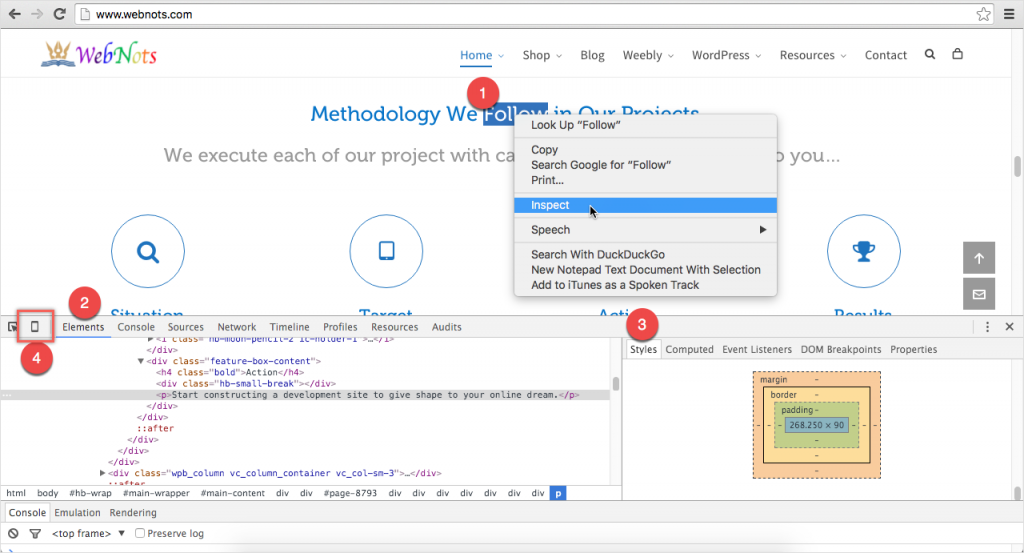
- Right-click on an element and choose “Inspect” option.
- View HTML and inline styles under “Elements” tab.
- View external styles under “Styles” section.
- Click on the “mobile” icon to view the site on mobile devices and check the corresponding source HTML / CSS for mobile content.
In order to view the CSS code of any particular element, click the “Select element” icon on top left corner of the console. Now, hover the mouse pointer over any element on the webpage to automatically show the CSS code of that element.

6. Viewing Mobile CSS
Since the styles for an element on desktop and mobile devices may vary, developer console offers an option to toggle the display to most of the popular devices like iPhone, iPad, Samsung Galaxy and Google Nexus. Once you select required device from the dropdown, Chrome will show you corresponding CSS codes for the selected device.

- Click on the toggle device toolbar button.
- Choose the device from the dropdown or click on the “Edit” option to add your own device not available in the default list. You can check the device dimension of the selected device.
- Increase or decrease the percentage to adjust the browser display.
- Click on the “Rotate” button to toggle between portrait and landscape views.
- Check the preview of your selection. Right-click on the element you want to view the mobile source and click on the “Inspect” option.
- Change the element to view the source. Hovering over the HTML code will highlight the corresponding element on the preview browser pane.
- Find the source CSS code of the selected element. The mobile CSS should start with “@media” rule. If there is no “@media” rule then the general CSS will be applied on mobile devices also.
7. Pretty Print View of Minified CSS and JavaScript Files
Nowadays it’s common to use minified versions of CSS and JavaScript files on websites. This will remove unnecessary comments, spaces, line breaks and makes the file as .min.css or .min.js. Also the caching mechanism used on the website does similar space removal. Though all these are done for improving the page speed, this makes the CSS and scripts unreadable for those looking the page source. Chrome resolves this problem by offering “Pretty Print” button. Clicking on the “Pretty Print” button will restore the minified files to a readable version so that you can easily go through it.
Here is an example of how the minified script looks on the developer console. View the linked style sheet or script under “Sources” tab. Click on the double bracelet brackets {}.

You will see the pretty print view of the script as below:

Note: Some webpages prevent right-clicking to avoid content copy, in that case you can access page source using developer tools menu option in Chrome (from three vertical dots icon > More Tools > Developer Tools).
8. Viewing Console Errors
Developer tools not only allows you to analyze the source code, but also check the errors when loading webpages. These errors are useful for website owners for troubleshooting and fixing the layout and functional issues. When you are in developer tools, go to the “Console” tab or click the error/warning icon to view the details.

9. Modifying Live Webpage Content Online
The biggest advantage of Chrome developer console is to play around on the live page to preview the changes directly on your browser. You can directly change or add CSS style in developer console to see the effect on a live page. For example, you can change the “font-size” of the “body” element and see the font size change is aligned appropriately. This is very useful option and saves lot of time without affecting real user experience otherwise you may need to change on a live site on iteration basis to find the suitable style.
Also the color picker is one of the favorite of web developers. You can change the colors of the elements online and preview instantly. You can copy the RGB or HEX color codes and use on your design like a pro.

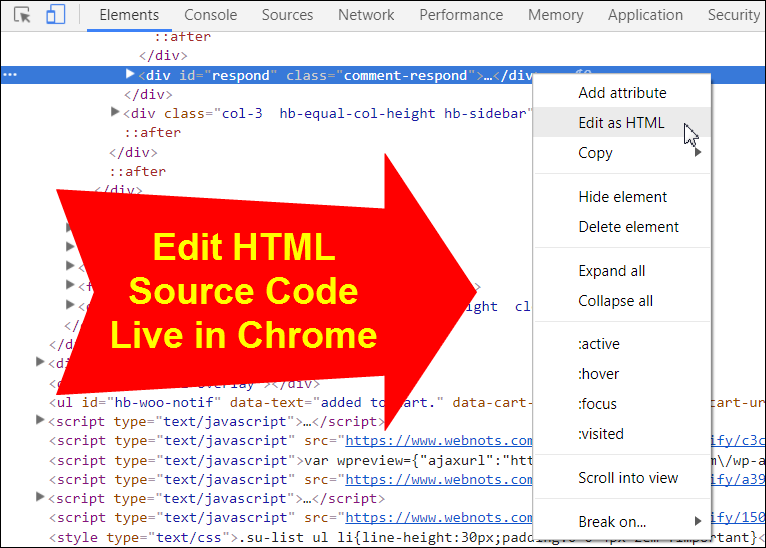
Right-click on of the HTML element and edit directly using “Edit as HTML” option to add or delete content online.
Learn more on how to view HTTP response structure on Chrome developer console.
10. Customizing Developer Tools
Click the gear icon showing nearer to the right corner of developer tools section to open the customization options. Alternatively, press F1 in Windows or “Shift + ?” mark in Mac to open the preferences panel. From here, you can change the appearance to light or dark theme, adjust the layout, enable or disable HTML comments, etc. to make the tool suitable for your use.

Final Words
We hope this article helped you to understand how to view source HTML, CSS and JS in Chrome. Remember, viewing source code is very generic action and any user can do this. But using developer console needs you to invest lot of time in learning. Since Chrome updates the features on every version, it makes the learning process continuous. However, it should be very interesting and fun for understanding and troubleshooting web designing concepts.



you shared clear step by step explanation content thank you for sharing
Good article, pics were outdated but I got the point. Yay now I can find people’s CSS!
Article is updated with the latest Chrome version pictures.
Great article, it help me to get a better understanding on what actually looking – when I view the source code. Also, now I can tell the difference between the HTML, CSS and Scripts ; difference between view source and inspect element