Visual Studio Code is widely loved for being fast, lightweight, and highly customizable code editor. However, after months of installing extensions, opening large projects, and tweaking settings, you may start noticing sluggish performance. Common symptoms include delayed typing, slow startup times, laggy scrolling, freezing during searches, or high CPU and memory usage. The good news is that most VS Code slowdowns are fixable within minutes. In many cases, the problem comes from a single extension, oversized workspace, or unnecessary background process. In this article, we’ll explain some of the most effective ways to diagnose and improve VS Code performance.
1. Audit Your Extensions
Extensions are the most common reason VS Code becomes slow. Every installed extension runs background processes, consumes RAM, and may constantly analyze your files. Even useful extensions can cause performance issues when too many are enabled at once.
- Start by opening the Extensions panel in VS Code using Ctrl + Shift + X on Windows or Cmd + Shift + X on macOS.
- Review all your installed extensions and ask yourself which ones you actually use regularly.
- Disable or uninstall extensions you rarely use.
Pay particular attention to:
- Language support extensions for programming languages you rarely work with.
- Multiple AI assistants running simultaneously.
- Heavy Git, Docker, Kubernetes, or linting tools.
- Theme packs and icon packs you no longer use.
- Duplicate functionality (for example, multiple formatters).
Instead of uninstalling everything immediately, try disabling extensions temporarily to identify the culprit. A good way to test performance is to start VS Code with all the extensions disabled.
If VS Code suddenly becomes fast, an extension is almost certainly responsible. To investigate further:
- Enable all extensions again and open the Command Palette (Ctrl + Shift + P or Cmd + Shift + P).
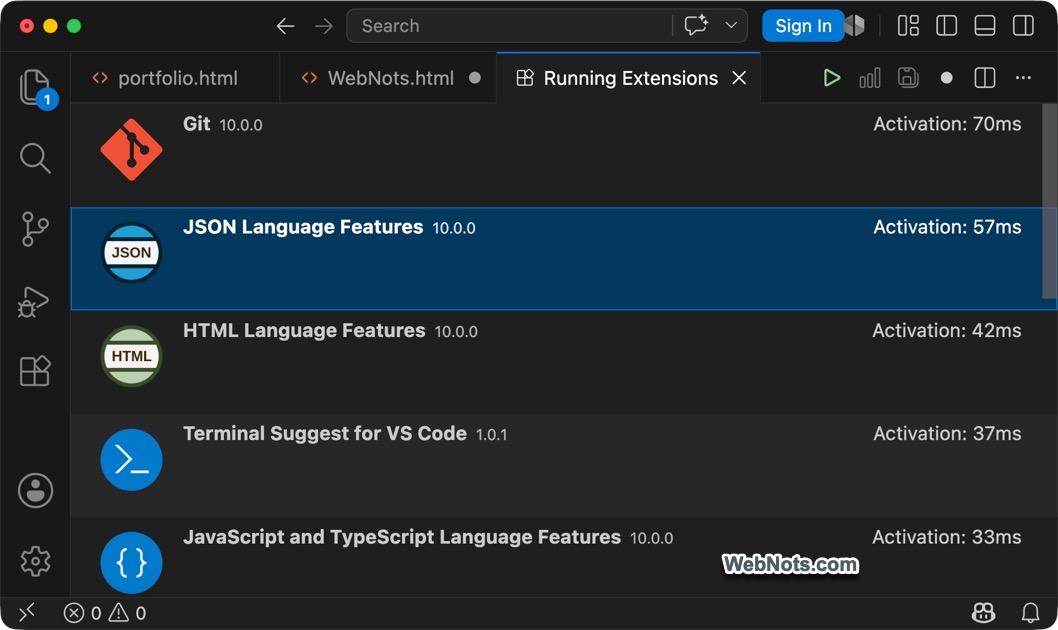
- Run Developer: Show Running Extensions command.
- Review the activation time impact.
Extensions with unusually high activation time or CPU usage should be disabled or replaced.
Tip: Keep your extension list lean. Most developers only need 5 to 15 essential extensions for a fast setup.
2. Reduce Workspace and File Load
VS Code struggles with massive files, deeply nested directories, and projects containing thousands of generated files. Large log files, minified CSS / JavaScript bundles, build folders, and dependency directories can significantly slow indexing and search.
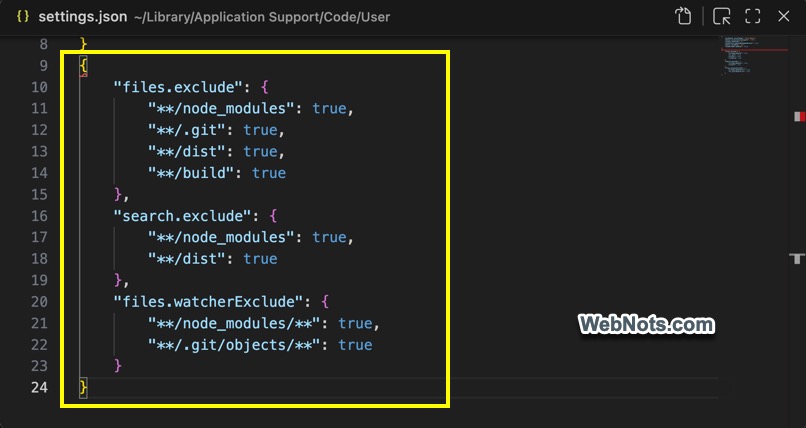
Some common performance offenders include node_modules, .git, dist, build, .next, coverage, large log files, and auto-generated assets. Exclude these folders from Explorer and Search using the settings.json file. Use Command Palette to find and open Preferences: Open User Settings JSON and add the following entries in the file:
{
    "files.exclude": {
        "**/node_modules": true,
        "**/.git": true,
        "**/dist": true,
        "**/build": true
    },
    "search.exclude": {
        "**/node_modules": true,
        "**/dist": true
    },
    "files.watcherExclude": {
        "**/node_modules/**": true,
        "**/.git/objects/**": true
    }
}
Alternatively, go to Settings UI to include or exclude entries visually.
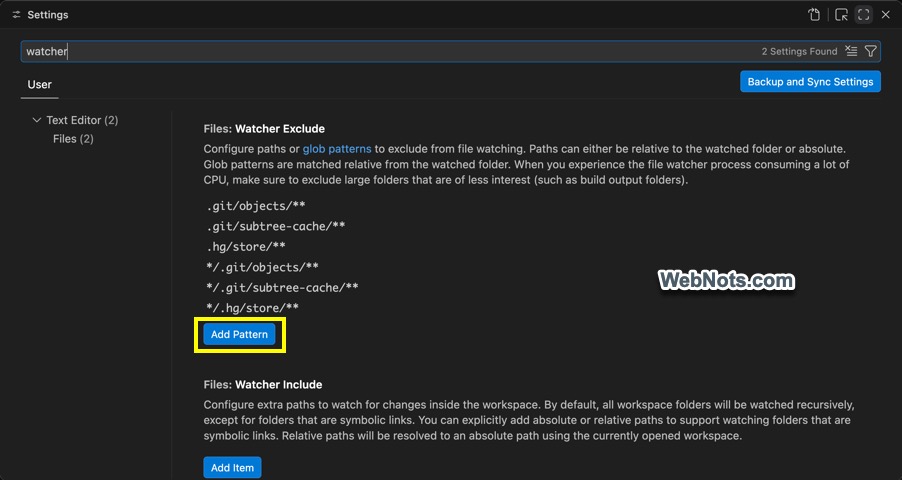
The files.exclude hides folders in Explorer, search.exclude prevents searching huge folders, and files.watcherExclude reduces CPU usage from file watching. The files.watcherExclude setting is particularly important because file watchers can heavily impact CPU usage in large repositories.
Note: You should also avoid opening extremely large files in VS Code whenever possible. Files containing millions of lines, compressed JSON, minified JavaScript, or multi-gigabyte logs are better viewed with dedicated tools. If you work in monorepos or enterprise projects, consider opening only the relevant folder instead of the entire repository.
3. Optimize Performance-Heavy Settings
Some editor features look useful but are surprisingly expensive in terms of rendering and memory usage, especially on older hardware or large files.
Open settings.json and consider the following adjustments:
{
    "editor.wordWrap": "off",
    "editor.minimap.enabled": false,
    "editor.smoothScrolling": false,
    "editor.renderWhitespace": "selection",
    "editor.renderLineHighlight": "line",
    "editor.guides.bracketPairs": false,
    "editor.stickyScroll.enabled": false,
    "editor.codeLens": false
}
Here is why these settings help:
- editor.wordWrap: Word wrapping can severely impact performance on long lines or minified code.
- editor.minimap.enabled: The minimap constantly redraws content and consumes GPU resources.
- editor.smoothScrolling: Smooth animations can make scrolling feel laggy on slower systems.
- editor.renderWhitespace: Rendering all whitespace characters increases visual overhead.
- editor.codeLens: Features like inline references and test indicators consume extra CPU.
- stickyScroll: Helpful visually but can feel sluggish in large files.
You do not need to disable everything permanently. Try turning off one feature at a time and measure the difference.
4. Use VS Code’s Built-In Performance Tools
VS Code includes several diagnostics tools that many users overlook. These tools help identify exactly what is causing lag instead of guessing. Run the following commands from Command Palette:
- Developer: Show Running Extensions: As explained above, this command helps to find the startup and activating impact of all running extensions. If one extension consistently takes several seconds to load, disable it.
- Developer: Startup Performance: Use this command to find which components slow down VS Code launch.
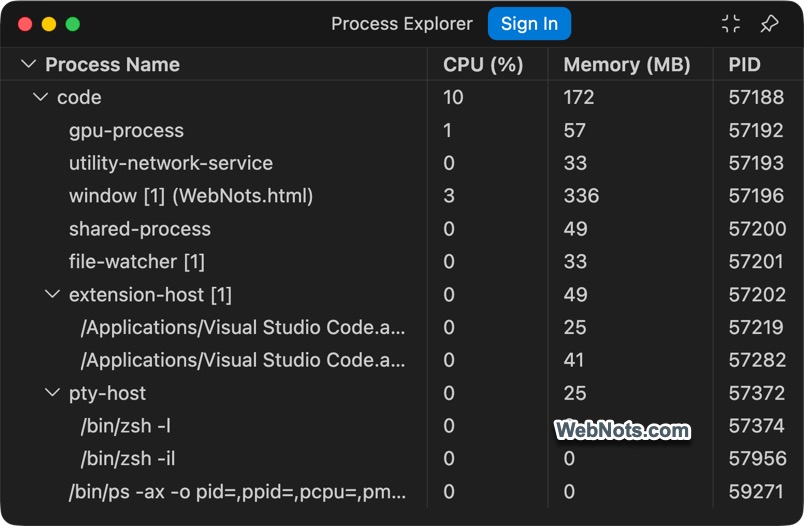
- Developer: Open Process Explorer: This shows RAM usage, CPU consumption, Renderer processes, and Extension host processes. If memory usage grows excessively or CPU remains high when idle, you likely have a problematic extension or oversized workspace.
5. Manage Language Servers and IntelliSense
Language servers power features such as auto-complete, diagnostics, IntelliSense, and error checking. While useful, they can become resource-intensive in large projects. For JavaScript and TypeScript projects, increase or limit TypeScript memory in settings.json depending on your machine:
{
    "typescript.tsserver.maxTsServerMemory": 4096
}
For lower-memory systems, reducing this value may actually improve responsiveness. The recommended values are 2048 for small projects, 4096 for large React/Next.js apps, and 8192 for very large monorepos. If your PC has low RAM, try 2048 first.
You can also exclude unnecessary folders from TypeScript analysis by configuring tsconfig.json or jsconfig.json:
{
  "exclude": [
    "node_modules",
    "dist",
    "build",
    ".next"
  ]
}
Here are some additional recommendations:
- Disable auto-import suggestions in very large projects.
- Turn off unused linters.
- Avoid running multiple formatters simultaneously.
- Use Workspace Trust to limit automatic execution in unfamiliar projects.
If IntelliSense becomes unresponsive, restarting the language server often helps by running the following command (from Command Palette):
TypeScript: Restart TS Server6. Fix GPU and Hardware Acceleration Problems
Sometimes VS Code feels slow because of rendering issues rather than CPU or extensions. Symptoms include choppy scrolling, flickering UI, delayed menus, laggy animations, and high GPU usage. In that case, try toggling GPU acceleration.
Use the following command in Terminal or Command Prompt and then launch VS Code with GPU disabled:
code --disable-gpuIf performance improves, your graphics driver or GPU acceleration may be the issue.
Note: If you get an error like ‘code’ is not recognized, it means the VS Code command-line tool is not added to PATH. To fix this, run Shell Command: Install ‘code’ command in PATH from Command Palette.
You can also permanently disable hardware acceleration by modifying startup arguments. Run Preferences: Configure Runtime Arguments from Command Palette to open argv.json file and add the following line:
{
    "disable-hardware-acceleration": true
}
If there are existing settings, add it with a comma like below:
{
    "enable-crash-reporter": true,
    "disable-hardware-acceleration": true
}
Save the file, completely close VS Code, open it again, and check it loads faster. On the other hand, if acceleration is already disabled and your GPU drivers are current, enabling it may improve performance.
Note: Keeping graphics drivers updated is especially important on Windows systems.
7. Reduce Startup Time
Slow startup is usually caused by extensions loading during launch. To improve startup speed:
- Disable startup-heavy extensions.
- Turn off unnecessary welcome pages.
- Avoid reopening extremely large workspaces automatically.
- Close unused tabs before exiting.
You can also review startup performance by running Developer: Startup Performance command to find which extensions delay launch.
8. Clear Cached Content
Over time, caches and configuration files can become bloated or corrupted. Follow the below steps to clear VS Code cache.
- Delete the content in the following folders in Windows:
%APPDATA%\Code\Cache
%APPDATA%\Code\CachedData
- Delete the content in the following folders on macOS:
~/Library/Application Support/Code/Cache
~/Library/Application Support/Code/CachedData
- Delete the following cached data in Linux:
~/.config/Code/Cache
~/.config/Code/CachedData
Restart VS Code afterward and check if that helps to speed up.
9. Check System Resources
Sometimes VS Code is not the problem at all. Your computer may simply be overloaded. Check for:
- Browser tabs consuming large amounts of RAM.
- Docker containers running in the background.
- Virtual machines.
- Memory-hungry development servers.
- Antivirus software aggressively scanning files.
On Windows, antivirus scanning inside node_modules folders can noticeably slow file operations. Excluding development directories from real-time scanning can also improve responsiveness.
10. Reset Corrupted Settings or Reinstall the App
If issues continue, a corrupted setting or extension configuration may be causing problems. Resetting VS Code settings can help identify whether a bad configuration is responsible.
First, close VS Code completely, follow the below steps and then restart the app.
- On Windows: Go to %APPDATA%\Code\User folder, locate settings.json and keybindings.json files. Rename the files something like settings-backup.json and keybindings-backup.json.
- On macOS: Open Finder, press Cmd + Shift + G to go to ~/Library/Application Support/Code/User folder and rename the files.
- On Linux: Open your file manager, go to ~/.config/Code/User folder, and rename the files.
This helps determine whether a bad configuration is responsible. VS Code will automatically generate fresh default versions of these files. If performance suddenly improves, one of your previous settings or keybindings was likely causing the issue. If needed, you can restore your old settings by copying settings back from the renamed backup files.
As a final step, reinstall VS Code completely if corruption or installation problems are suspected.
Quick Performance Checklist
Before assuming VS Code is broken, run through this checklist:
- Keep VS Code and extensions updated.
- Review extensions and remove unused items.
- Open only relevant project folders.
- Exclude large folders from search and indexing.
- Disable minimap and word wrap for large projects.
- Avoid unnecessary Remote Development sessions.
- Monitor and reduce system CPU and memory usage.
A clean VS Code setup with only essential extensions should still feel extremely fast, even on modest hardware. In most cases, one problematic extension or oversized workspace is the real cause of slow performance. Start with an extension audit first because it solves the majority of issues in less than five minutes.