Most Windows users know the basics: open Task Manager with Ctrl + Shift + Esc, end a frozen program, or check CPU usage. But buried inside this system tool are powerful features that can transform how you monitor, troubleshoot, and optimize your PC. Here are the 10 hidden tricks you’ve probably never tried.
1. Make Task Manager Always on Top
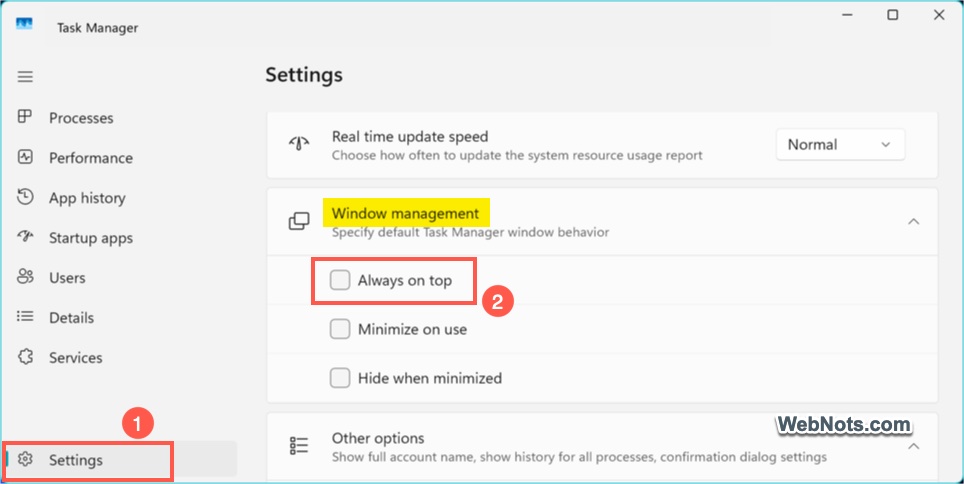
While debugging crashes or watching resource spikes, other windows keep covering Task Manager app. Fix this frustration by going to “Settings” and check “Always on Top” option under “Window management” section. Now it stays visible over every app help spotting a sudden disk usage spike while testing or troubleshooting.
2. The Hidden Startup Impact Score
The “Startup apps” tab shows a list of apps will launch when you boot the system. You can find the status (under “Status” column) and enable or disable an app. But look closer at the “Startup impact” column. It rates programs as “Low”, “Medium”, or “High” based on real boot-time measurements. Click the column header to sort and quickly find the impact of your startup apps. Disable anything marked “High” that you don’t need immediately to boot your PC faster.
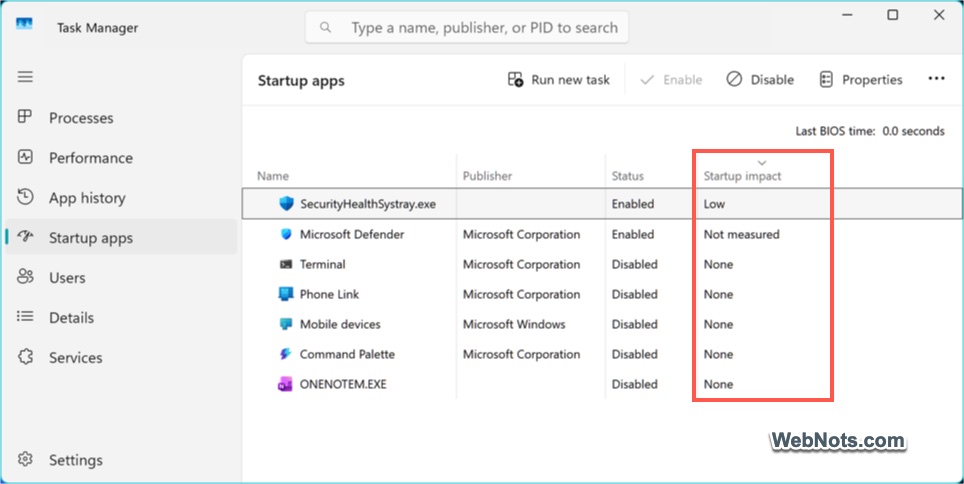
Note: If that column is not visible, right-click on any column header and select “Startup type”.
3. Launching Resource Monitor
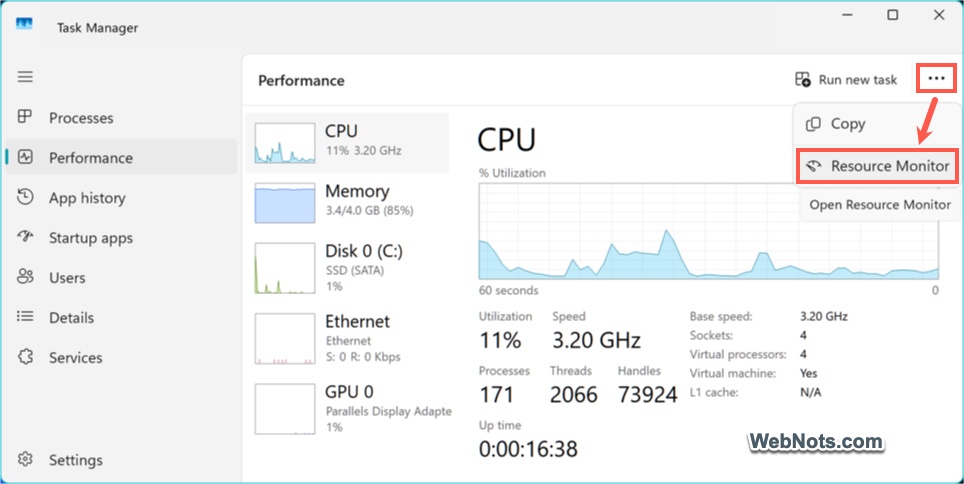
On the “Performance” tab, click “See more” three dots icon on top right and select “Resource Monitor” option. This launches a deeper tool where you can see exactly which files a process is locking, which TCP ports are open, and even analyze memory status.
4. The Efficiency Mode Toggle
Right-click any process and choose “Efficiency mode” or click that option on top toolbar. Confirm your action and you will see an icon (two green leaves) under “Status” column. This limits the process’s priority and forces it to use less power ideal for browser tabs or background utilities hogging CPU.
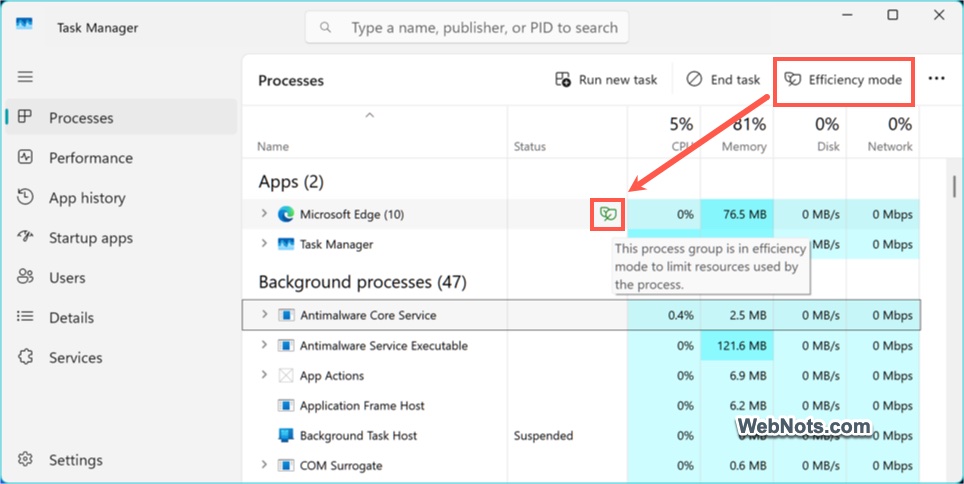
Warning: Don’t use this on Windows processes or games; performance will tank.
5. See Apps Really Draining CPU / Network
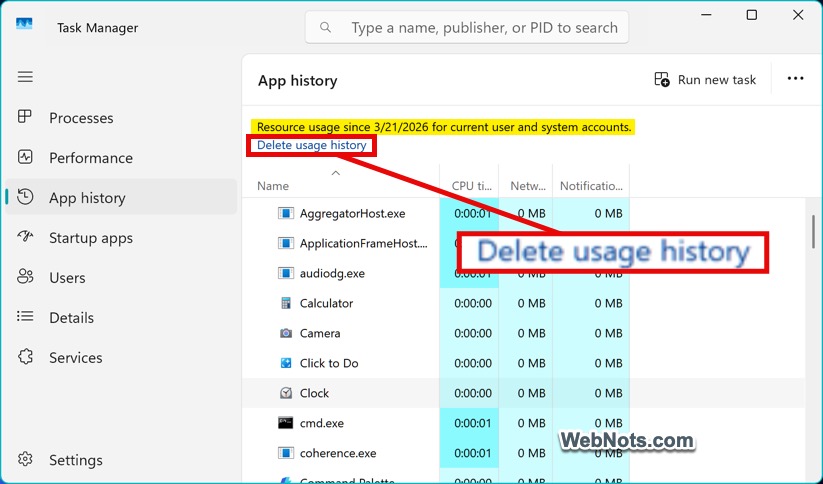
The “App history” tab reveals total CPU time and network usage for each app over the past month. You can right-click on the column header and add additional columns like Metered network, Non-metered network, Uploads, and Downloads to find the complete usage history. Click “Delete usage history” before a long flight, then monitor which apps are secretly burning your network or CPU.
6. Group Processes by Type
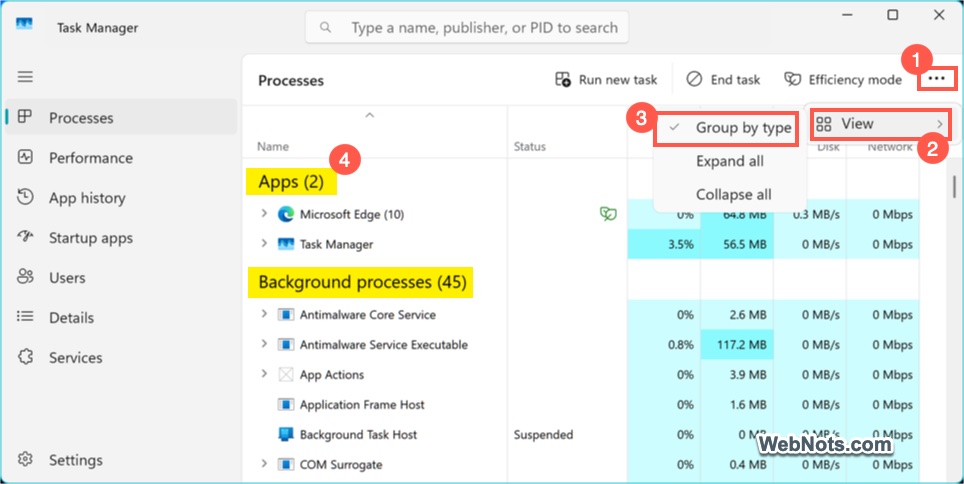
On the Processes tab, right-click the column headers and enable Group by type. This separates process into “Windows processes”, “Background processes”, and “Apps” and instantly reveal whether a system process or a third-party utility is the real resource hog.
7. Copy Performance Data as Text
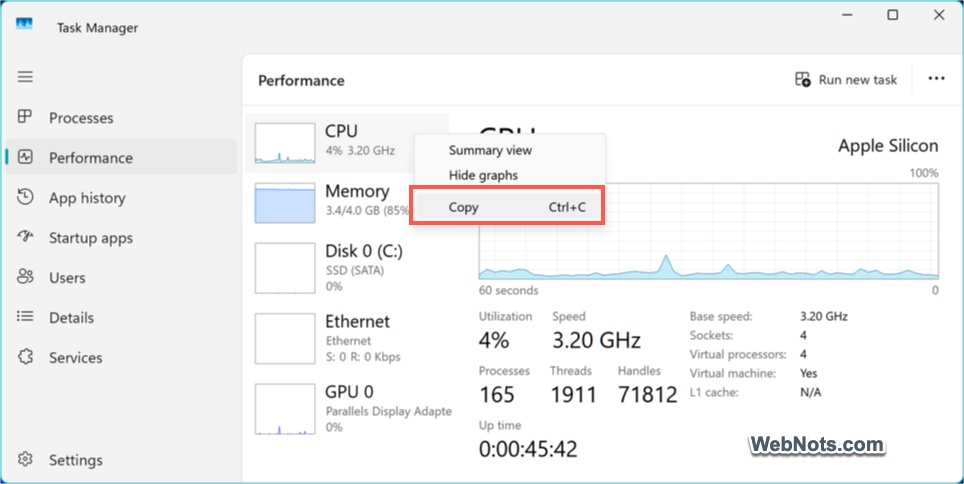
Go to “Performance” tab and select an item (for example – CPU). Right-click on the item and select “Copy” or press Ctrl + C keys. This copies the real-time graphs and numbers as text. You can paste the text into an email or ticket when asking for tech support, which is far more useful than a screenshot.
8. Monitor Real-Time Power Usage
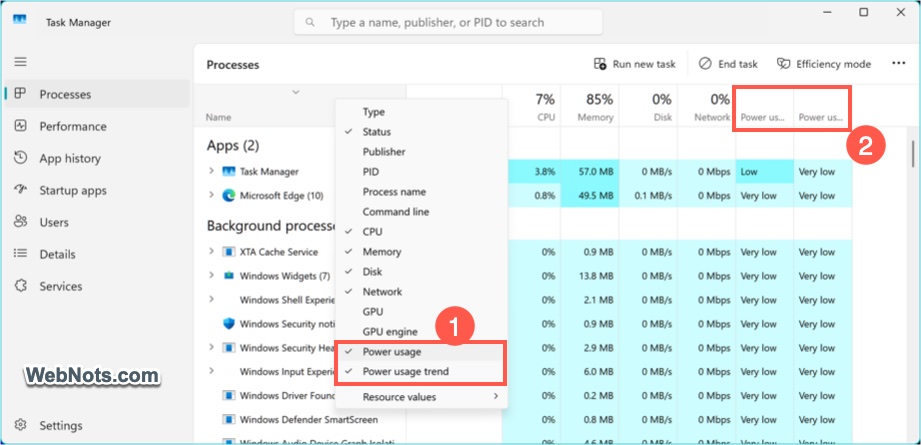
Go to “Processes” tab, right-click on the column header and select “Power usage” and “Power usage trend” options. This adds the selected columns in the view. Click the “Power usage” column header to sort and find which processes are using high power and take action.
9. Set Default Launch Tab
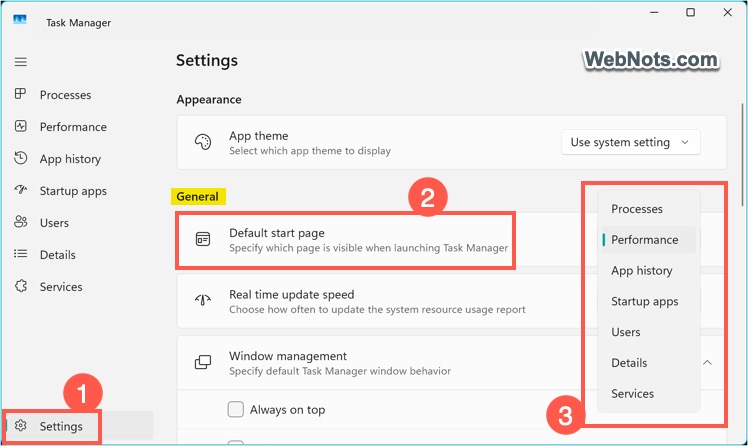
By default, Task Manager opens with the “Processes” tab. This will be annoying if you always to monitor the performance or check startup apps. Click the “Settings” on sidebar bottom and find “Default start page” option under “General” section. Click the dropdown to find all available tabs and select the one you want to see after launching the app.
Note: Most tabs show the layout in default columns. Right-click on the column header to find the hidden columns and add them to your layout.
10. Monitor Performance Summary
By default, the “Performance” tabs shows the graphs and data for each category (like CPU or Memory). Right-click on any empty area and select “Graph summary view” option. This hides the entire app and shows only the summary graph of the selected category (like CPU). In this way, you can monitor the CPU, Network, or Memory usage while testing without keeping the entire Task Manager open.
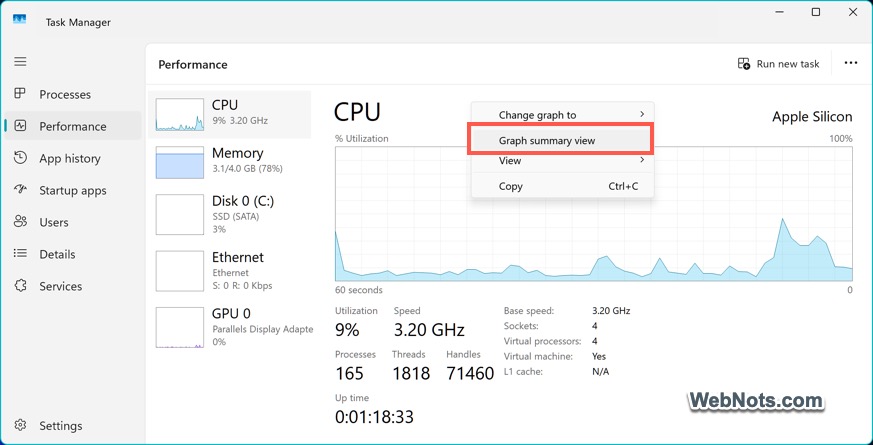
Any time, right-click on the summary graph and deselect “Graph summary view” to return back the app.
Final Words
Task Manager isn’t just for killing frozen apps. Spend ten minutes exploring these tricks, and gain control over the processes, services, and apps running on your Windows PC without installing a single third-party tool.